Introduction and Selection Criteria
The existence of the heliospheric current sheet (HCS), earlier known observationally as an interplanetary sector boundary, has been known since Wilcox and Ness first identified it three decades ago [Wilcox and Ness, 1965]. Many of its intriguing characteristics have been revealed since then, especially its connection to the warped solar neutral surface [Schulz, 1973], its large-scale 3-D nature [Smith et al., 1978; Klein and Burlaga, 1980; Thomas and Smith, 1981], its morphological evolution with solar cycle [Hoeksema et al., 1983], and its latitudinal extent [Smith et al., 1978, 1993]. Our primary goals here are threefold: (1) to determine the large-scale (i.e., 1-2 AU) properties of the HCS from analysis of WIND MFI data, (2) to compare these results to potential field - source surface models of the current sheet near the sun [Hoeksema, 1989], and (3) to present related findings on the heliospheric plasma sheet surrounding the HCS, based on a preliminary survey of the field intensity for a substantial subset of the HCS events and motivated by a recent study by Winterhalter et al. [1994].
Specifically we examine and analyze magnetic field data around extended time periods of HCS crossings observed by the WIND spacecraft. These identified crossings occurred in 20 sets with typically 10 or more individual crossings in a set. There were, in fact, 212 individual crossings (271 candidates reduced to 212 by variance analysis and other editing) resolved in the approximately 5 month period 12 November 1994 to April 1995, the period of study so far.
The magnetic field data used in the study was from the magnetometer (MFI) onboard the WIND spacecraft [Lepping et al., 1995]. We employed variance analysis [Sonnerup and Cahill, 1968] of the magnetic fields within the transition regions of the HCS crossings, in order to estimate the directions normal to the planes of the discontinuities, the local current sheets. Most of the analysis was carried out with 3.0 s (spin period of the WIND) averages of the field, but when broad transitions were encountered 1.0 minute averages were used. An initial survey of the IMF data was made by visual inspection after which we eliminated unacceptable candidates through variance analysis. Specifically, we demanded (1) that the field longitude must vary from one approximately "stable" value to another, and (2) that the observed change in longitude of the field across the transition be > 130°. Finally, screening was done on the basis of unacceptable eigenvalue ratios (viz., mid/min ratio < 5, especially).
The definition of an individual HCS crossing used in this work was a field transition through about 180° in no more than 10's of minutes from one sector-state polarity to the other, allowing for the fact that the field in either sector is often not aligned with the Parker prediction, but tends to be so on average. The "180° direction change" (often it was not) across the discontinuity could be partly attributed to latitude (field theta) change, but typically it was mainly a longitude (phi) change, where these angles are measured in a GSE coordinate system. Often the principal part of the directional change occurred in a small fraction of the 10's of minutes, but the full transition was always considered in the analysis.
Large-Scale Findings and Solar Source Surface Model Comparisons
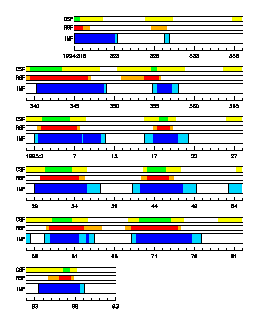 Figure 1 shows the observed distribution of sectors during the observation period, which occurred near solar minimum. The data is presented in 27-day panels to allow easy identification of solar rotation periodicities. The blue strips, within these panels, indicate
the IMF polarity measured by WIND. A dark blue strip indicates negative polarity
while a white strip indicates positive polarity. The light blue intervals
are the regions where the multiple individual HCS crossings were identified
via the variance analysis. On average there is a noticeable vertical alignment
of the strips indicating a periodicity at the solar rotation period. It
is also noteworthy that during this period WIND observed the smooth change-over
from a 2 sector structure (1 + and 1 - sector) to a four sector structure
(2 + and 2 - sectors). The width of the negative sector in the middle of
each 27-day time strip is slowly growing with time until the end of our
observation period, where the 4 sectors have nearly the same length. In
terms of the solar source, the four-sector pattern developed as the nearly
flat but inclined neutral line formed a new warp that crossed the ecliptic
plane. This resulted in a progressive change from a pair of 180 degree
sectors to a set of four caused by the 90 degree warps of the neutral line
[see Hoeksema et al., 1983]. Hence, in the frame of reference of
WIND, for the particular speeds of the solar wind observed, the "four
sector" structure in 3-D corresponds to a 1 - 2 AU wave at 1 AU, which
is a particular example of a "ballerina skirt" current sheet
[for this model see Smith et al., 1978].
Next we attempted to correlate this large scale evolution of the HCS to the timing of magnetic field variations on the surface of the Sun as determined by models. We started with the source surface map of the coronal field by Hoeksema [1989] and determined the times when the Earth-Sun line crossed the solar magnetic equator. (An example of such a source surface map is given in Figure 3 of Crooker et al., [1996].) Using the radial solar wind velocity measurements at WIND propagated back to the surface of the Sun properly taking into account the rotation of the Sun (although ignoring all possible interactions between adjacent fluid parcels which lead to a significant uncertainty in our mapping). Then we determined the times when solar wind plasma observed at WIND could have originated from the solar equatorial regions. In our modeling we employed two versions: (1) the "classic" (CSF) coronal potential field source surface model, which uses the "line-of-sight" inner boundary condition and a polar field correction at a source surface at 2.5 RS (where RS is the radius of the Sun), and (2) a "radial" (RSF) inner boundary condition model, which has no polar field correction and has a source surface radius of 3.25 RS. The RSF model is described by Wang and Sheeley [1992]. Figure 1 also shows the results of the correlation of the source surface models with the WIND observations. The green and orange lines (marked by either CSF or RSF) correspond to times when we believe that the solar wind had originated from the negative polarity region of the Sun, whereas the white panels indicate positive polarity source areas. Also, to give some indication of the sharpness of the transition from one polarity to the next, we have marked by yellow segments the periods when the Earth-Sun line was within a certain small angle of the solar magnetic neutral line: 0.1° for the RSF model and 1.0° for the CSF model (the RSF model is much flatter and, hence, the Earth-Sun line stays much closer to the computed heliomagnetic equator). To achieve good correlations between the solar predictions and indications of HCS's from WIND data, we had to offset the solar wind propagation time by one extra day. (This one day estimate is preliminary and will be refined with a quantitative analysis when a full year's worth of WIND data is accumulated.) Part of this offset is likely to be due to the slower solar wind average speed due to the acceleration known to occur between the source surface and about 20 RS [Bird and Edenhofer, 1990], and partly to our ignoring effects of stream interactions. Also there is about ±1 day uncertainty in our propagation time determination. Nevertheless, the correlation is remarkable, clearly showing the close relationship between the evolution of the solar magnetic fields and the HCS.
Results of Variance Analysis
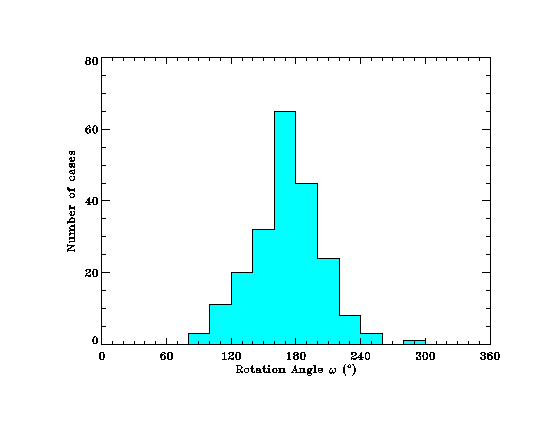 The variance analysis provides estimates of the discontinuity
angle, omega (which is defined as the full angular excursion of the field in
the current sheet, as measured in the discontinuity plane), the longitude
and latitude of the normal to the current sheet, the ratio of BN/B,
and the type of the discontinuity based on this ratio; by type we mean
either a rotational discontinuity (RD) or tangential discontinuity (TD)
or an ambiguous case. We can make only an average estimate of current sheet
thickness by assuming that the solar wind flows radially from the sun at
420 km/s. The average thickness was found to be 6.4 x 10⁴ km,
a value consistent with those found by Villante and Bruno [1982]
based on Helios 2 data. Figure 2 shows the distribution of the rotation
angle, omega, for the full 212 good cases of crossings showing that the most
probable value for omega is about 180° (strictly it is 175°), as expected. There
is a relatively broad spread of values from about 80° to 260°, ignoring a
few extreme values. It is noteworthy that it was not too uncommon for omega to
exceed 180°. The mean and standard deviation for the distribution in the
figure are 171° and 31°.
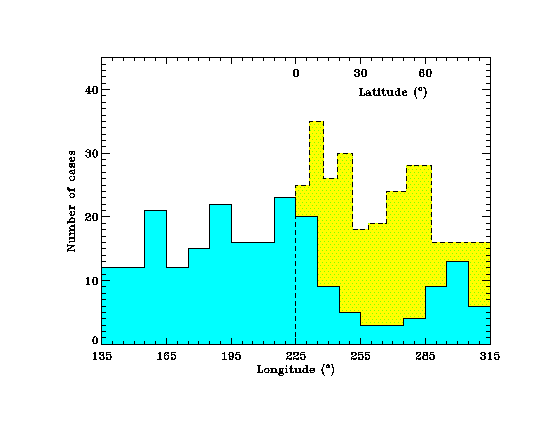 Figure 3
presents a histogram of the longitudes (blue histogram)
of the 212 normals indicating a tendency to occur in the ortho-Parker
direction, which is along 225°, but with a big spread of values. A question
that we will address at a later time is, what causes this large spread?
Actually the most probable value is 225° and the mean and the standard deviation
are 211° and 68°, respectively. Likewise, the spread of values for the absolute
values of the latitudes of the normals is large, as presented on the yellow
histogram of Figure 3, showing that the
most probable value is 10°. A distribution of actual latitudes (not their
absolute values), which is approximately symmetric about 0°, has a mean
and standard deviations of 5.3° and 32.5°, respectively. So the HCS has a
moderate preference to be perpendicular to the ecliptic plane at 1 AU at
the phase of the solar cycle covered here, but cases of the HCS lying nearly
in the ecliptic are not uncommon. The angle-distributions presented in
Figure 3 are obviously important to understanding the large scale geometry
of the HCS; note that they are not dissimilar to those found by Behannon
et al. [1981]. Now we address probably the most important property
of the current sheet itself, its basic nature. Is it primarily an RD or
a TD? The answer addresses how it locally propagates in the solar wind,
its internal structure, and how it interacts with the internal and surrounding
plasma.
Figure 3
presents a histogram of the longitudes (blue histogram)
of the 212 normals indicating a tendency to occur in the ortho-Parker
direction, which is along 225°, but with a big spread of values. A question
that we will address at a later time is, what causes this large spread?
Actually the most probable value is 225° and the mean and the standard deviation
are 211° and 68°, respectively. Likewise, the spread of values for the absolute
values of the latitudes of the normals is large, as presented on the yellow
histogram of Figure 3, showing that the
most probable value is 10°. A distribution of actual latitudes (not their
absolute values), which is approximately symmetric about 0°, has a mean
and standard deviations of 5.3° and 32.5°, respectively. So the HCS has a
moderate preference to be perpendicular to the ecliptic plane at 1 AU at
the phase of the solar cycle covered here, but cases of the HCS lying nearly
in the ecliptic are not uncommon. The angle-distributions presented in
Figure 3 are obviously important to understanding the large scale geometry
of the HCS; note that they are not dissimilar to those found by Behannon
et al. [1981]. Now we address probably the most important property
of the current sheet itself, its basic nature. Is it primarily an RD or
a TD? The answer addresses how it locally propagates in the solar wind,
its internal structure, and how it interacts with the internal and surrounding
plasma.
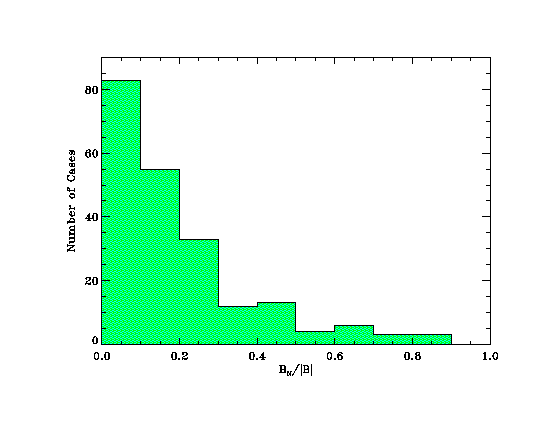 Figure 4
shows a distribution of BN/|B|
for the 212 cases, showing that the most probable value is zero (or very
small compared to the average value), which should not be unexpected, since
all tangential TD'S have zero BN/|B|, and many RD's have very
small relative normals [Lepping and Behannon, 1986]. We now envision
that for each value of BN/|B| in the distribution we can invent
a negative value of equal absolute value and add the new distribution to
the old one, such that the "left side" will be a mirror image
of the "right side". We then find the average and standard deviation
of this combined distribution, which are 0 (by design) and 0.265, respectively.
The latter gives a quantitative measure of the spread of this ratio, which
is considerable. Since there is always a band of low ratios throughout
which we cannot uniquely separate TD's from RD's we are unable to uniquely
provide an accurate ratio or these types. It is as if one type merges into
the other, at least from the point of view of how the two types propagate
and interact with nearby plasma. There are, however, many RD's with large
normal components. We judge that at least 1/3 of the cases are definitely
RD's with large or at least significant BN.
Preliminary Examination of the Plasma Sheet
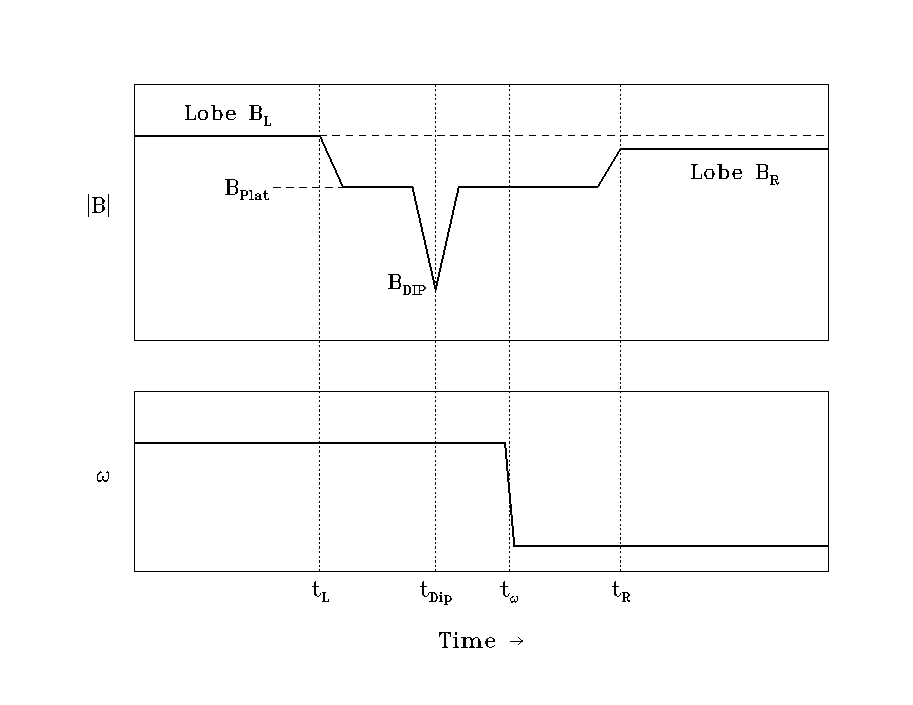 We examined the field magnitude around a directional
discontinuity comprising the current sheet for a about one half of the
cases (covering the period: days 323, 1994 to 037, 1995), in an attempt
to ascertain if the profile recently discussed by Winterhalter et al.
[1994] could be confirmed (See Figure 5). This provided 115 current sheets. The microstructure
of each current sheet was well resolved down to the 100 km scale, appropriate
for such a study. The profiles often revealed complex structure with little
universal character. We were specifically looking for broad dips (plateaus)
within which deep dips may be present, asymmetries, and/or any timing relationships
of the directional discontinuity to the field magnitude profile. The detailed
(but preliminary) results of the study are presented by Lepping et al.
[1996]. We summarize a few salient features here. About 73% of the individual
current sheets examined were associated with significant magnetic field
magnitude dips, which are at or near the directional discontinuity, within
an interval of about 20 minutes on each side on average. Some cases show
a drop to almost zero field, within the measurement accuracy of the instrument.
The most apparent discovery found from this study is that most of the field
magnitude profiles of a plasma sheet, whenever they exist, look like severely
"noised up" versions of the Winterhalter et al. [1994]
profile, at best. However, there seem to be some observable
patterns, such as, occasionally we see an apparent slow change in field
longitude-angle associated with little or no change in |B|. In that case
there appears to be no plasma sheet. On the other hand, when |B| drops
to almost zero (or at least drops significantly), when the existence of
a plasma sheet is most apparent, there is a much greater chance that there
will be an abrupt change in the longitude angle of the field. Although
only qualitatively understood so far, these are new findings, and have
no obvious explanation.
The average plasma sheet thickness is about 7 x 10⁵ km (or about 6 times the size of Earth's dayside magnetosphere), and its distribution is very broad, where we have assumed an average solar wind speed of 420 km/s, and have taken the HCS surface normal directions into account. This average thickness is about an order of magnitude larger than the average HCS thickness (as quoted above), an estimated ratio which is independent of our assumption of the average solar wind speed.
Summary
We examined some properties of the HCS during the first 5 months of the WIND mission. From analysis of WIND magnetic field data we found a gradual evolution of quasi-periodic variations of the HCS on the scale of 1-2 AU showing a gradual evolution from a 2 sector to a 4 sector pattern over this period. Typically up to tens of individual current sheet crossings were observed in broad "transition-zones", sometimes lasting a full day, before the IMF sector polarity became stable. All of the 271 fitted individual current sheets are characterized by large magnetic field rotations (omega often being near 180°). An average HCS thickness was derived to be about 6 x 10⁴ km. The longitudes and latitudes of the normals to the individual current sheets are distributed over the whole range of possible orientations, except they show a small preference towards the ortho-Parker and anti-Sunward directions. The latitude distribution clearly reveals that current sheets at 1 AU are often of steep inclination, even though during this epoch the HCS usually possesses very shallow slopes at the Sun, based on a potential field-source surface model [Hoeksema, 1989]. However, the source surface model provides current-sheet Earth-crossing times that agree very well with the observations at WIND. This correlation is especially remarkable, since the period of study is near solar minimum. About 1/3 of the individual current sheets are RD's with significant normal field components. Preliminary examination was made of field intensity profiles, to better understand the plasma sheet surrounding the HCS [e.g., Winterhalter et al., 1994]. Such profiles often have a very complex character seeming to elude universal characterization. However, about 73% of individual current sheets are associated with significant magnetic field magnitude dips, which are at or at least near the directional discontinuity of the current sheet, within an interval of about 20 on each side on average. An average plasma sheet thickness at 1 AU was preliminary estimated to be 7 x 10⁵ km. A much more comprehensive and imaginative study of such field signatures must yet be made.
References
This page is largely based upon the publication:
Lepping, R. P., A. Szabo, M. Peredo, and J. T. Hoeksema, Large-scale properties and solar connection of the heliospheric current and plasma sheets: WIND observations, Geophys. Res. Lett., 23, 1199, 1996.References on this page:
Behannon, K. W., F. M. Neubauer, and H. Barnstorf, Fine-scale characteristics of interplanetary sector boundaries, J. Geophys. Res., 86, 3273-3287, 1981.
Bird, M. K., and P. Edenhofer, Remote sensing observations of the solar corona, in Physics of the Inner Heliosphere, 1, Large-Scale Phenomena, edited by R. Schwenn and E. Marsch, Springer-Verlag, Berlin Heidelberg, 1990.
Crooker, N. U., A. J. Lazarus, R. P. Lepping, K. W. Ogilvie, J. T. Steinberg, A. Szabo, and T. G. Onsager, A two-stream four-sector, geoeffective recurrence pattern near solar cycle 22 minimum, Geophys. Res. Lett., this issue.
Hoeksema, J. T., Extending the Sun's magnetic field through the three-dimension heliosphere, Adv. Space Res., 9, (4)141-(4)152, 1989.
Hoeksema, J. T., J. M. Wilcox, and P. H. Scherrer, The structure of the heliospheric current sheet: 1978-1982, J. Geophys. Res., 88, 9910, 1983.
Klein, L., and L. F. Burlaga, Interplanetary sector boundaries 1971-1973, J. Geophys. Res., 85, 2269-2276, 1980.
Lepping, R. P., and K. W. Behannon, Magnetic field directional discontinuities: Characteristics between 0.46 and 1.0 AU, J. Geophys. Res., 91, 8725, 1986.
Lepping, R. P., et al., The WIND magnetic field investigation, Space Sci. Rev., 71, 207-229, 1995.
Lepping, R. P., A. Szabo, M. Peredo, and A. Campbell, Summary of heliospheric current/plasma sheet studies: WIND observations, in Proceedings of Solar Wind Eight, edited by D. Winterhalter, J. Gosling, S. Habbal, W. Kurth, and M. Neugebauer, in press, Dana Point, CA, 1996.
Schulz, M., Interplanetary sector structure and the heliomagnetic equator, Astrophys. Space Sci., 34, 371, 1973.
Smith, E. J., B. T. Tsurutani, and R. L. Rosenberg, Observations of the interplanetary sector structure up to heliographic latitudes of 16°: Pioneer 11, J. Geophys. Res., 83, 717-724, 1978.
Smith, E. J., M. Neugebauer, A. Balogh, S. J. Bame, G. Erdos, R. J. Forsyth, B. E. Goldstein, J. L. Phillips, and B. T. Tsurutani, Disappearance of the heliospheric sector structure at Ulysses, Geophys. Res. Lett., 20, 2327-2330, 1993.
Sonnerup, B. U. O., and L. J. Cahill, Jr., Explorer 12 observations of the magnetopause current layer, J. Geophys. Res., 73, 1757, 1968.
Thomas, B. T., and E. J. Smith, The structure and dynamics of the heliospheric current sheet, J. Geophys. Res., 86, 105, 1981.
Villante, U., and R. Bruno, Structure of current sheets in the sector boundaries: Helios 2 observations during early 1976, J. Geophys. Res., 87, 607-612, 1982.
Wang, Y.-M., and N. R. Sheeley, Jr., On potential field models of the solar corona, Astrophys. J., 392, 310, 1992.
Wilcox J. M., and N. F. Ness, Quasi-stationary corotating structure in the interplanetary medium, J. Geophys. Res., 70, 5793, 1965.
Winterhalter, D., E. J. Smith, M. E. Burton, N. Murphy, and D. J. McComas, The heliospheric plasma sheet, J. Geophys. Res., 99, 6667, 1994.
For a complete WIND MFI reference list see the WIND MFI Bibliography page.
A table of the HCS Crossing Times is currently under development and will be placed here in the future. Please check back.
