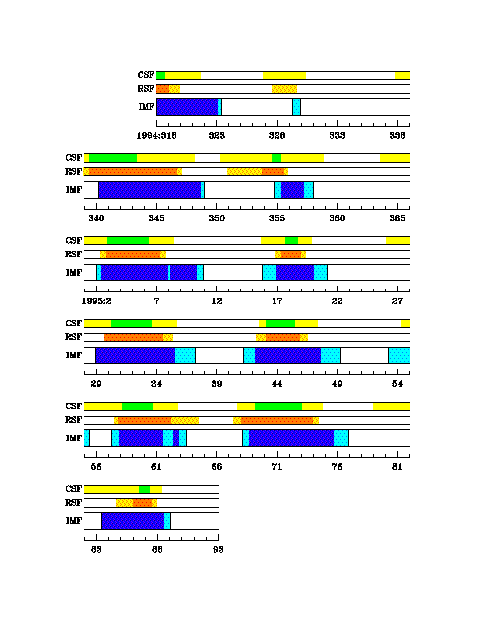

Delineations of heliospheric sector polarity changes from WIND magnetometer data, on a 27-day format, from 14 Nov., 1994, to 3 April, 1995. Time runs downward. On the broadest bars dark blue strips represent negative sectors and the white strips are positive sectors. The light blue regions are intervals when the multiple crossings of the HCS were observed. The (thinner) green and orange bars represent the regions that result from mapping the times of the intersection of the solar magnetic equator and the ecliptic plane to 1 AU, according to two potential field-source surface models: CSF (green) representing the Classic Solar Field and RSF (orange) representing Radial Solar Field models with the propagation time slightly offset; see text.